Monetise better: Charge more for additional value with Tableau User Attribute Functions
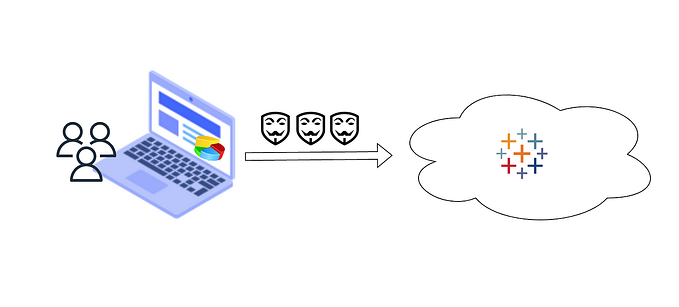
One of my customers serves their clients with analytics through a client portal that exposes data in the form of Tableau Embedded dashboards. Currently, this customer’s clients are charged the same and see the same data inside the dashboards.
My client would like to charge more for additional value, creating a premium member tier.
In this article, I present how we’ve leveraged some of the latest Tableau features to unlock data and capabilities that can be monetised inside the dashboards. In particular, I’ll present these as three use cases:
- Conditional Viz in Tooltip for Magnified Maps
- Benchmarking drillthrough dashboard
- Larger historical data set
After these changes, their customer portal pricing model could look like this:

To deliver on this requirement with minimum effort, we’ll leverage the newly released User Attribute Functions (UAF) in combination with other well-known features, such as as Calculations, Dynamic Zone Visibility, Viz in Tooltips.
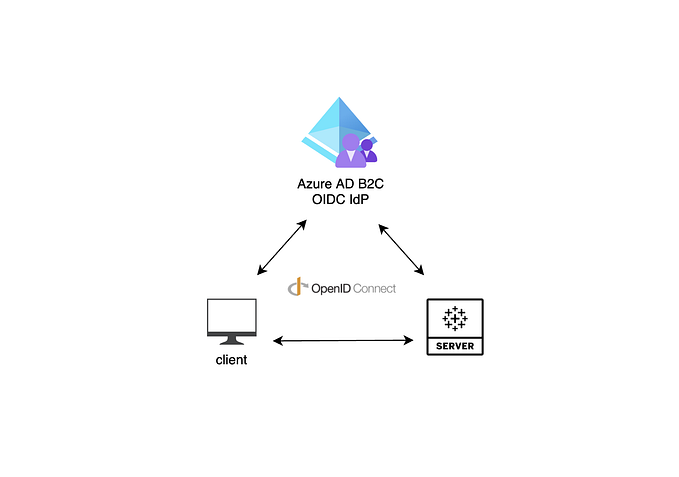
JWT Single Sign-On auth for Embedded Analytics (aka Connected Apps), is the main building block of the solution, which involves passing the user’s tier as an attribute during the authentication (i.e., a custom User Attribute):
💡 User Attribute Functions (available for Tableau Cloud since v2023.1)
The user attribute functions allow user attributes to be captured by Tableau at runtime as part of the authentication workflow. When user attributes are passed via JSON Web Tokens (JWTs), embedded content authored with these functions can control and customize data displayed to users.
In other words, Tableau will always be aware of the attribute value(s) set during the SSO authentication and can leverage them inside visualizations, just like a traditional parameter could. The main difference here is that users cannot tamper with the attribute values as they could with parameters. So, you can start to imagine leveraging it for all sorts of scenarios, e.g. ABAC: Attribute-Based Access Control, row-level security, conditional date range filters, conditional UI object visibility, and so on.
In our case, the JWT contains a user attribute that we call ‘Tier’ to represente their client’s subcription membership, and the allowable values are ‘Basic’ or ‘Premium’. You could add more attributes if needed for your use case!
Use Case 1) Conditional Viz in Tooltips for Magnified Maps
💡 Viz in Tooltip (available since v10.5)
Viz in Tooltip allows you to place visualisations of your own design into tooltips, revealing them on hover or selection of individual marks. The data in the viz is automatically filtered to the mark you hover on or select, giving you and your users precise views of the pertinent data.
Step 1) Create your dashboard with the Viz-in-Tooltip (ViT)
Make sure to create three sets of vizzes to show in the tooltip, as per the official doc, with the following caveat: to create a Conditional ViT that will render either the actual magnified map or a sample map (i.e., a teaser to entice users to upgrade membership), I’ve used the technique described in this KB article.
1.a) The first ViT contains the actual magnified map data you wish to display to the Premium users when they hover over:

1.b) For the second ViT you can use a background image with sample dataset and a message to tease the users to upgrade to Premium, displaying it in the tooltip as they hover over the map:

Pro tip: You could include multiple Vizzes in the tooltip to Premium users, e.g. with stats like Avg Claim price, Total # of Claims, # of Claims trends over time, and so on.
Step 2) Create the UAF — User Attribute function

Pro tip: for testing, temporarily add an escape condition to this calc, so that you can continue seeing the dash components without having to implement the JWT-based auth with the UAF variable.
…and add it as a data source filter → custom value → keep only ‘True’:

Step 3) Create the JWT auth token, including the ‘Tier’ attribute

Done! Now the key:value pair Tier:Premium or Tier:Basic will be leveraged by all our conditional in-dashboard experiences, such as this magnified Viz-in-Tooltip map 🤩
Use Case 2) Benchmarking Drillthrough Dashboard

💡 Dynamic Zone Visibility (available for Tableau Server and Cloud since 2022.3)
Dashboard space is valuable, especially when you want to progressively reveal insights about data. With Dynamic Zone Visibility, you can hide or reveal zones (tiled or floating dashboard elements) based on the value of a field or parameter. As you interact, zones on your dashboard appear or disappear. The result is a dynamic dashboard that doesn’t compromise your desired layout.
Step 1) Design the Dashboard with Data Monetisation mindset
Create the top-level and drill-through dashboards and define which elements you wish to expose to Basic vs Premium users. Use Navigation Buttons and Parameter Actions to create an experience highly personalised and contextualized to the user’s selections.
In the example below, we’re looking at the “Insurance Portfolio” top-level dashboard, available to all users on all tiers. In contrast, the “Benchmarking” button (top-right corner) should only be visible to 💎 Premium users, as it is the button that allow a user to trigger the drill-down functionality to access the underlying Benchmarking Dashboard:

This means users on any pricing tier can make interact freely with the top-level dashboard (e.g., to apply filters to see summaries for selected Insurance Brokers). However as a Premium user I have access to additional funcitonaly: I’ve selected “Bradtke-Lind” and clicked on the (now visible) Benchmarking button to drill-through and reach the paid-for Benchmarking dashboard:

The implementation involves a Parameter Action to store the user’s selection of Broker into a workbook parameter, which will then be carried over to the underlying Benchmarking dashboard when the (now visible) navigation button is clicked (keep reading to understand how to enable the button hide/unhide):

Step 2) Create the “User Attribute Function”
This function allows us to create an arbitrary attribute that will be set by the portal based on the user pricing tier during the single-sign on auth flow for the embedded dashboard in your portal.
In this example, your app would pass the ‘Tier’ attribute when creating the JWT. The calculation returns TRUE or FALSE and that’s what we’ll use to dynamically determine which components to show/hide to each user:

Pro tip: for testing, temporarily add an escape condition on this calc, so that you can continue seeing the dash components without having to implement the JWT-based auth with the UAF variable.
Step 3) Enable “Dynamic Zone Visibility” to show/hide premium dash components
In the Layout Pane, enable “Control visibility using value” and choose the boolean calculation created in Step 2. Repeat for any other relevant navigation buttons you wish to restrict access:

Repeat the steps on the actual drill-through (premium) dashboard, the Benchmarking one in my case. This is because an ill-intentioned user could try to open it outside of the embedded context of your app.
Super important: Pay special attention to the “Item hierachchy” and make sure to enable this Dynamic Zone Visibility feature to the outermost container that encapsulates all other containers. This will significantly minimize the chance of an ill-intentioned user to access this premium dashboard while being a member of the Basic tier (e.g., by trying to fiddle with the document’s css).
Here’s how it looks on our example:

IMPORTANT DATA SECURITY REMARK: Dynamic User Visibility is NOT a security feature, but rather a convenience one!
You can follow the above instructions to make it extremely difficult for users to ever access premium capabilities by tapping on Dynamic Zone Visibility. However, an ill-intentioned user may still find a way to fiddle with the CSS and “unlock” this data. Therefore, to fully secure your precious data, we strongly suggest you ensure proper row-level security is implemented, regardless of whether you leverage this feature or not.
On the other hand, Usage Attribute Functions are inherently secure and may be used as an Access Control (i.e., security) feature, e.g., for the implementation of row-Level security without having to leverage Entitlement Tables, which can be difficult to maintain.
Use Case 3) Larger historical data set
Our goal here is to limit Basic membership users to just 2 years of data and Premium ones to 10. Here’s one way to achieve this using Level of Detail Expressions (LODs), in order to find the last date on our dataset:

Pro tip: We’re again implementing an escape condition here for testing, so we don’t get blank dashboards when not using JWT auth (i.e. during the dashboard development phase).
…then add this calc as a Data Source Filter and keep only TRUE:

…and that’s it. Easy right? Now you can use UAF to personalise and monetise your valuable data and innovative in-dashboard user experiences.
You may have noticed you can leverage the new User Attribute Functions to drive all sorts of personalizations required. The UAF attribute is secure and cannot be tampered by end users. Furthermore, it can be leveraged just like a traditional Parameters to drive all sorts of interactivity and filtering.
Luckily, users have no way to tamper with UAF to try to get unauthorised access to dashboard capabilitie, zones, level-2 and 3 drillthrough dashboards and proprietary data, as it’s fully controlled by your web app when generated the auth token (JWT).
I’d love to hear how you’ve monetised your data with these or other techniques. Share your comments below!

